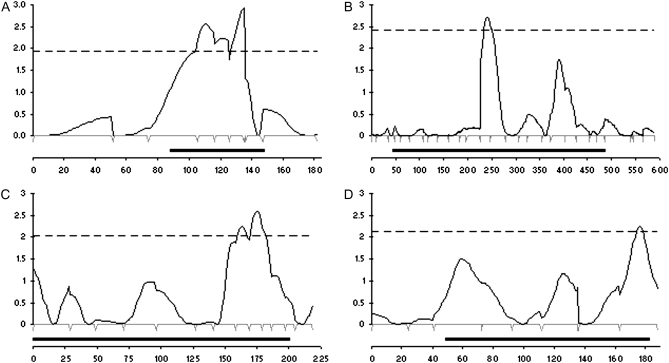
Figure 2.—
Interval maps of the four linkage groups containing significant QTL at 5% false discovery rate. LOD score (y-axis) was calculated at 1-cM intervals across each linkage group (x-axis). The 5% empirical threshold is indicated by the dashed line. Ninety-five percent confidence intervals are shown by solid bars. Microsatellite marker positions are indicated by peaks just below each x-axis. Maps A, B, C, and D show linkage groups 15, 1, 7, and 13 and QTL OvA1, OvA2, OvA3, and OvA4, respectively.

