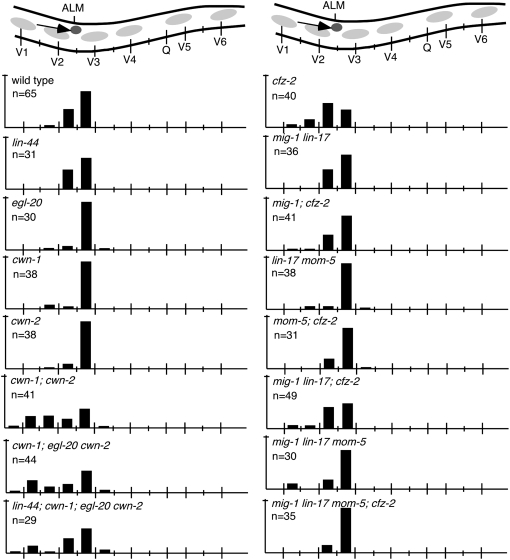
Figure 2.—
ALM cell migration. (Top) A schematic of the middle section of an animal with the ALM cell (darkly shaded circle) and its migration route (arrow). Bars represent the percentage of ALM cells located at that position along the anterior–posterior axis of L1 larvae. Long tick marks on the animal (top) and on the x-axis denote the location of V- and Q-cell nuclei and short tick marks denote the location of P-cell nuclei. The tick mark on the y-axis indicates 100%. n, number of ALM cells tallied.

