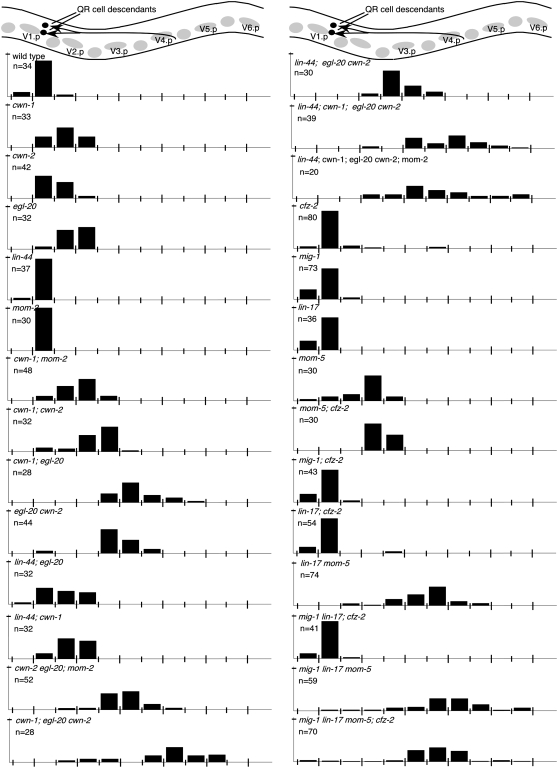
Figure 8.—
QR-descendant migration. (Top) A schematic lateral view of the middle section of a late L1 animal. Lightly shaded circles and ovals show the position of landmark Vn.a and Vn.p nuclei (each Vn.p is named). The final positions of the cell bodies of the QR descendants, SDQ and AVM (darkly shaded circles), and their migration routes (darkly shaded arrows) are indicated. Bars represent the percentage of QR descendants located at that position along the anterior–posterior axis of L1 larvae. The long tick marks on the x-axis indicate the location of Vn.p nuclei and the short tick marks indicate the location of Vn.a nuclei. The tick mark on the y-axis denotes 100%. Data for SDQ and AVM were combined. AQR was not included because it migrates to a location near other neurons, making its position difficult to score.

