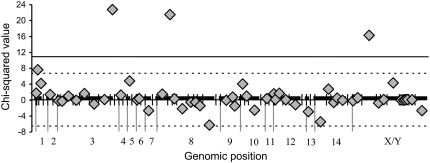
Figure 3.—
Comparison of centimorgan distances between all pairs of adjacent markers in the abnormally developing progeny to distances in the parental-type progeny is shown on the y-axis, with the χ2-values for each interval shown with a shaded diamond. Negative χ2-values indicate increased recombination in the parental-type progeny. The thick horizontal lines represent linkage groups (numbered below) with the hashes showing marker locations. Significance thresholds are shown with thin horizontal lines (solid, P < 0.001; dashed, P < 0.01). Three intervals showed significant deviation following a Bonferroni correction from 1:1 map distances between the two samples (P < 0.0001).

