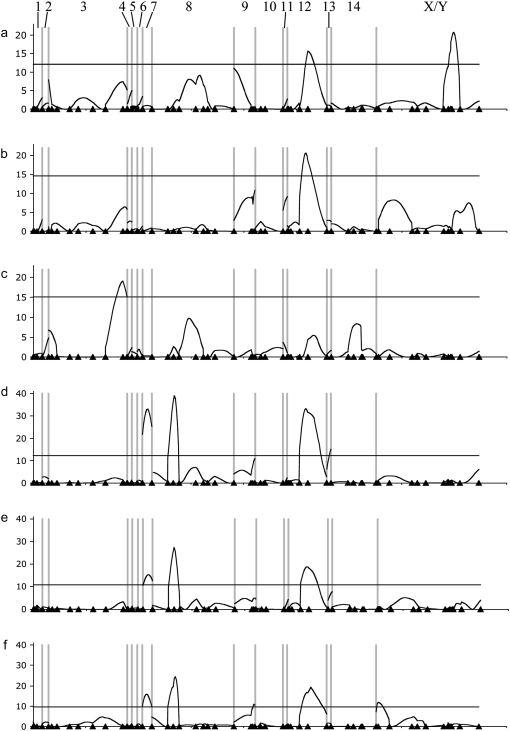
Figure 4.—
Position of significant QTL detected in the CIM analyses of normal variation (a, total data set, n = 159; b, males, n = 89; c, females, n = 70) and hybrid breakdown (d, total data set, n = 288; e, males, n = 161; f, females, n = 127). Chromosomal position, with markers indicated by triangles, is shown on the x-axis, and LOD score is shown on y-axis. The horizontal lines indicate significance threshold values of P = 0.05 generated by permutation (see materials and methods).

