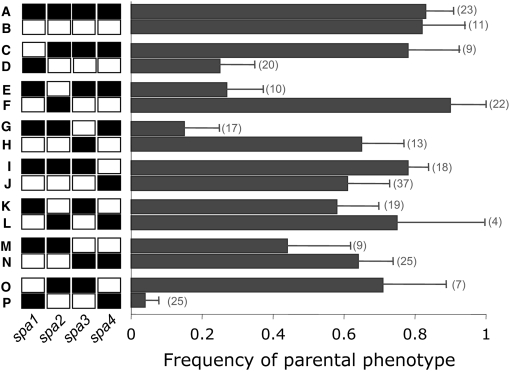
Figure 5.—
Proportion of progeny with a parental phenotype at all 16 possible genotypes at spa1–4, using the marker most closely linked to the QTL. Chromosomal regions from NY are solid and those from Ec are white, with parental genotypes (A and B), single introgressions (C–J), and double introgressions (K–P); reciprocal introgressions are paired to illustrate the asymmetry of allelic effects. Whiskers indicate standard errors, and number of progeny with each genotype is shaded to the right of the bars.

