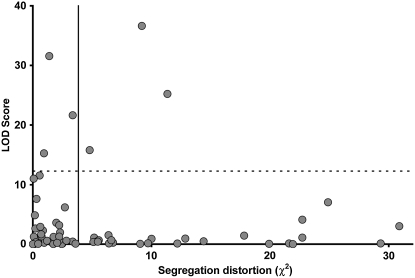
Figure 6.—
A plot of segregation-distortion χ2-values and LOD scores (for association with the hybrid-breakdown phenotype) for all mapped markers (r2 = 0.0, P = 0.81). The solid vertical line indicates the threshold for significant segregation distortion (α = 0.05, χ2 = 3.84), and the dashed vertical line shows the significance threshold for association with the hybrid-breakdown phenotype generated by permutation (LOD = 10.6).

