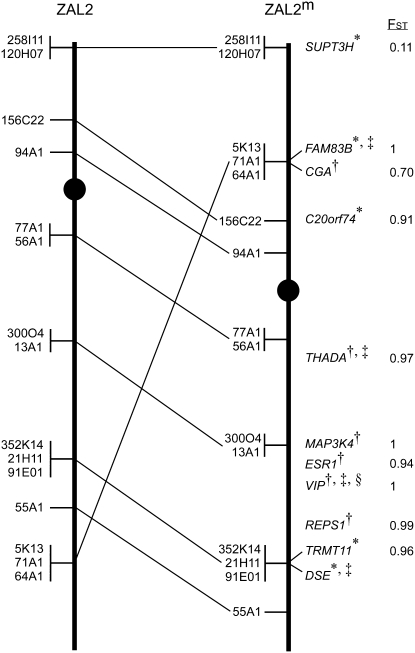
Figure 2.—
Summary of the cytogenetic mapping of ZAL2 and ZAL2m and gene flow between the chromosomes. The positions of the zebra finch BAC clones mapped by FISH to the ZAL2 (left) and ZAL2m (right) chromosomes are indicated. In cases where the order of the BAC clones could not be reliably resolved, the clones were grouped together (vertical line) and listed in an arbitrary order. Lines between the chromosomes indicate the relative position of the markers on the two chromosomes. Centromeres are represented by solid circles. The gene names and FST values for loci included in the population genetics studies are listed to the right of ZAL2m in their respective positions along this chromosome. The positions of the genes were directly determined by FISH (*) or inferred on the basis of flanking markers and the orthologous position on GGA3 (†). The subset of the loci that were genotyped in a larger panel of WS and TS birds are denoted by “‡.” The “§” indicates that the VIP genotyping results were previously reported in Michopoulos et al. (2007).

