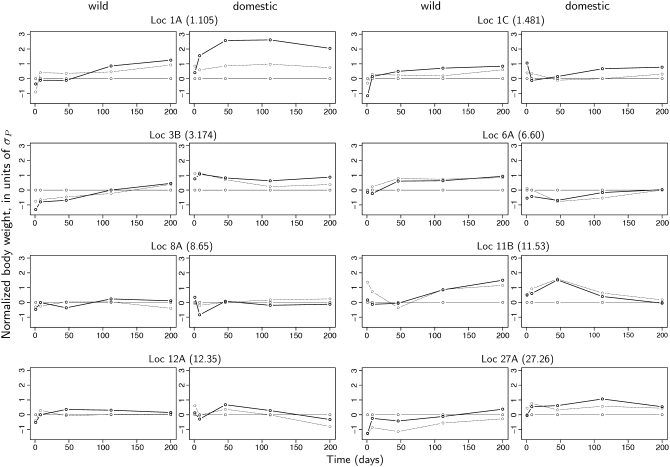
Figure 2.—
Genetic effects of individual loci in wild and domestic genetic backgrounds. The estimated phenotypic effect of “2” (“Leghorn” or “domestic”) alleles at each of the 8 loci included in the regression analysis in the “wild” (left plots) and “domestic” genetic backgrounds (right plots). The reference is always the “11” (homozygote wild) genotype (solid thin line) in both backgrounds, and plots are scaled according to the residual variance at each age. Additive and dominance effects can be extracted in each plot from the dotted and thick solid lines representing the heterozygote (“12”) and the homozygote domestic (“22”) genotypes, respectively. Epistasis is evident in the comparison of the genetic effects in the alternative genetic backgrounds (if there was no epistasis, right and left plots should be identical). For instance, being 22 instead of 11 at locus 1A increases the body weight at 200 days by ∼1.2σP in the “jungle fowl” background (11 genotype at all other loci) and by about 2σP in the “Leghorn” background (22 genotype at all other loci).

