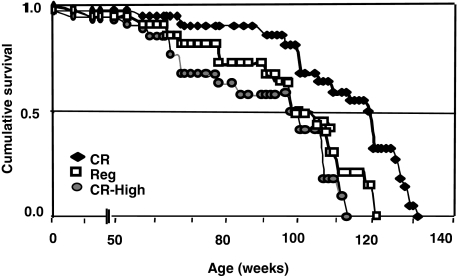
Figure 10.
Survival, chronic study. Kaplan-Meier survival curves in Reg mice (open squares), CR mice (filled triangles), and CR-high mice (filled circles) (n = 22 per group). Lifespan of Low and CR groups was significantly longer than in Reg (P < 0.004) and CR-high groups (P < 0.0001). Lifespan in CR-high mice was significantly shorter than in Reg (P < 0.02), CR (P < 0.001). Differences between the curves were estimated by the log rank test (see Table 3 for detailed analyses).

