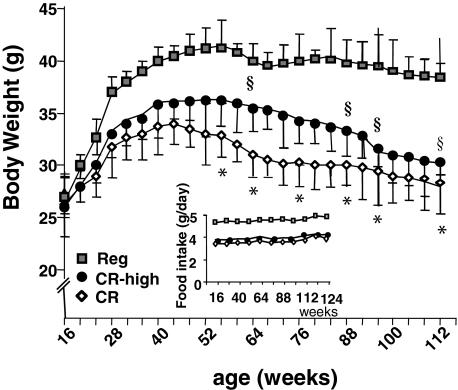
Figure 2.
Body weight, chronic study. Mice were pair-fed a CR diet, a CR-high diet, or regular diet (Reg) for life (n = 22 per group) as per Table 1. Food intake (g/day) is shown in the inset. Data are shown as means ± SEM. CR versus Reg, *P < 0.001; CR-high versus Reg, §P < 0.01.

