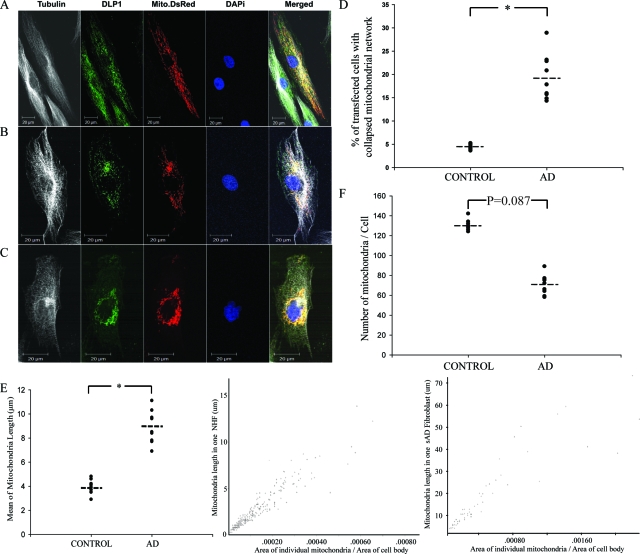
Figure 1.
sAD fibroblasts demonstrate abnormal mitochondrial distribution and morphology compared to NHFs. A–C: Three distinct patterns of mitochondrial distribution were seen in fibroblasts. Representative fluorescence images show mitochondria (red), DLP1 (green), α-tubulin (white) and nuclear (blue). In the majority of NHFs (>95%), mitochondria are evenly distributed throughout the cytoplasm (A). In approximately 20% of sAD fibroblasts, the mitochondrial network is partially collapsed with the majority of mitochondria clustering around the perinuclear area (B). In approximately 2% of sAD fibroblasts, the mitochondrial network is completely collapsed with all mitochondria densely clustering around the nucleus (C). D: Quantitative analysis revealed significantly more sAD fibroblasts displaying an abnormal mitochondrial distribution pattern (B and C) compared to NHFs (P < 0.05). E: sAD fibroblasts with normal mitochondrial distribution pattern also demonstrate significantly elongated mitochondria compared to NHFs (left panel) (P < 0.05). Center and right panels show the typical distribution of mitochondrial length versus mitochondrial size for a typical NHF (center panel) and sAD fibroblast with a normal mitochondrial distribution pattern (right panel). F: There is a trend of decreased mitochondrial number in sAD fibroblasts with normal mitochondrial distribution pattern compared to that of NHFs (P = 0.087).

