Figure 3.
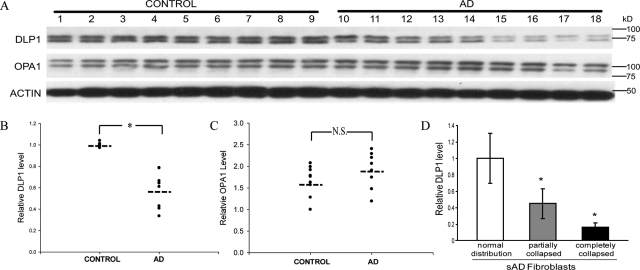
The level of DLP1 changes in sAD fibroblasts. A: A representative immunoblot of cell lysates of sAD fibroblasts and age-matched NHFs probed with antibody against DLP1. A parallel blot was probed with antibody against OPA1. The same membranes were stripped and reprobed with actin antibody as an internal loading control. Equal protein amounts (20 μg) were loaded. B and C: Quantification of the DLP1 or OPA1 reactive bands, normalized to actin levels, reveals significantly decreased levels of DLP1 but no changes in OPA1 levels in sAD fibroblasts (n = 9) compared to age-matched NHFs (n = 9). D: sAD fibroblasts with abnormal mitochondrial distribution demonstrate greater reduction in DLP1 levels compared to those with a normal mitochondrial distribution pattern. DLP1 levels in individual sAD fibroblasts were measured based on quantification of DLP1 fluorescent immunoreactivity (*P < 0.05; N.S., not significant, Student’s t-test).

