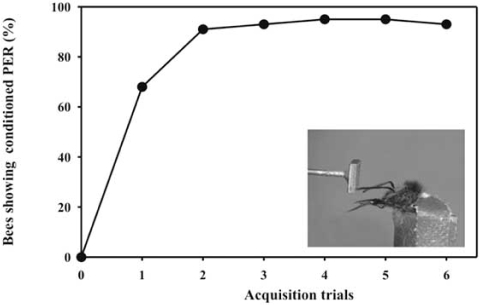
Fig. (7).
Acquisition curve in tactile antennal learning. The x-axis shows the number of acquisition trials. The y-axis displays the percentage of bees showing the conditioned proboscis extension response (PER). After only two conditioning trials, the bees reach a stable plateau in their learning performance. The inlet displays a bee showing conditioned proboscis extension while it scans the conditioned stimulus, a small metal plate.

