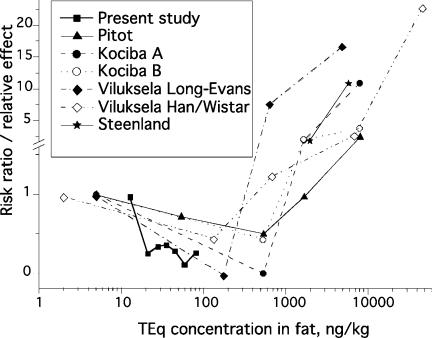
FIGURE 4.
Comparison of risk ratios from a chronic rat carcinogenicity bioassay (Kociba et al., 1978, A is only hepatocellular carcinomas in female rats, B is hepatocellular carcinomas, hepatocellular hyperplastic nodules, and bile duct adenomas), two tumor promotion assays (Pitot et al., 1987; Viluksela et al., 2000, two rat strains, sensitive Long-Evans and resistant Han/Wistar) and the present study. Abscissa is the measured TCDD (Kociba et al., 1978) or TEq (the present study) concentration in adipose tissue. For the data of Pitot et al. the same concentrations after the same doses were assumed as given by Kociba et al., the lowest dose (0.1 ng/kg/d) was assumed to cause one tenth of that after the lowest dose measured by Kociba et al. (1 ng/kg/d). Also the risk of soft tissue sarcoma given by Steenland et al. (1999) is given at two levels, the whole subcohort of measured values (233 ng/kg fat; Fingerhut et al., 1991) backcalculated at 2000 ng/kg (Steenland et al., 1999), and the high-exposure subgroup (418 ng/kg fat; Fingerhut et al., 1991) approximated by us at 6000 ng/kg. These backcalculations may include a major error, if half-life after a high exposure is much shorter than assumed (Aylward et al., 2005). This error would mean higher actual concentrations at the end of exposure, and move the points to the right even by one order of magnitude or more.

