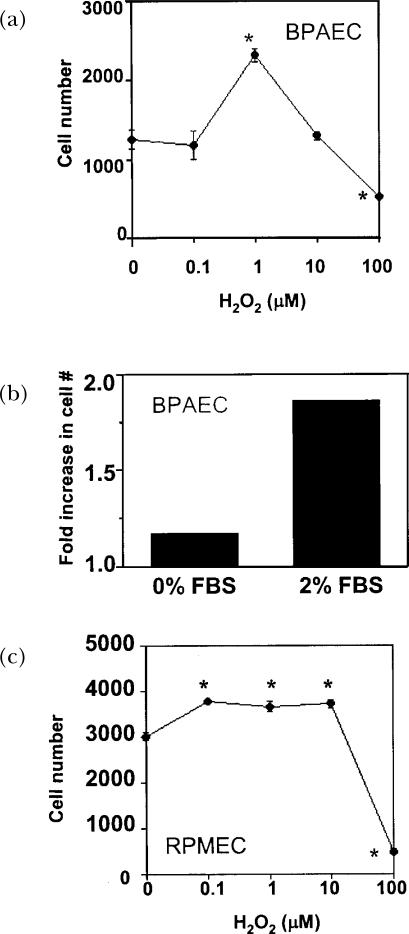
FIGURE 1.
Effects of H2O2 on bovine PAEC and RPMEC growth. (A) Bovine PAEC (BPAEC) were treated with varied concentrations of H2O2 for 48 h in medium containing 2% FBS. (B) BPAEC were treated with 1 μM H2O2 for 48 h in medium containing 0 or 2% FBS. (C) RPMEC were treated with varied concentrations of H2O2 for 48 h in medium containing 2% FBS. The number of cells was determined by Coulter counting. Values represent means ± SE, n=3. ∗Values differ from the 0 μM H2O2 control at p<0.05. Work of Day et al. is being reproduced with permission (Day et al., 2003).

