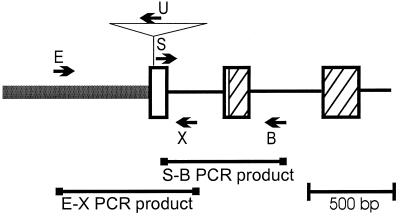
Figure 1.
Diagram of PCR primers and products. The map shows the upstream region (thick line), exon 1 (open box), which is not translated, exons 2 and 3 (the cross-hatched area indicates translated sequence), and introns 1, 2, and 3 (thin lines) of the b gene. Exons 4–9 and introns 4–8 are not shown. The insertion (depicted by the triangle) represents sequences found in B-Peru and B-Bolivia, and U is a primer specific to this region that was used to amplify B-Bolivia upstream sequences. The locations of the primers used in this paper and the PCR products generated are shown. See Materials and Methods for the primer sequences and exact locations.

