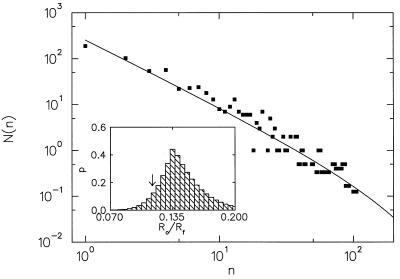
Figure 3.
The abundance distribution of fossil marine animal orders (6) (squares) and the predicted curve from the branching model (solid line). The fossil data have been binned above n = 37 with a variable bin size (http://xxx.lanl.gov/abs/cond-mat/9903085). The predicted curve was generated by using Ro/Rf = No/Nf = 0.115, where No and Nf were obtained directly from the fossil data. (Inset) Kolmogorov–Smirnov significance levels P obtained from comparison of the fossil data to several predicted distributions with different values of Ro/Rf, showing that the data are best fit by Ro/Rf = 0.135. The arrow points to our prediction Ro/Rf = 0.115 where P = 0.12. A Monte Carlo analysis shows that for a sample size of 626 (as we have here), the predicted Ro/Rf = 0.115 is within the 66% confidence interval of the best fit Ro/Rf = 0.135 (P = 0.44). The Kolmogorov–Smirnov tests were done after removal of the first point, which suffers from sampling uncertainties.

