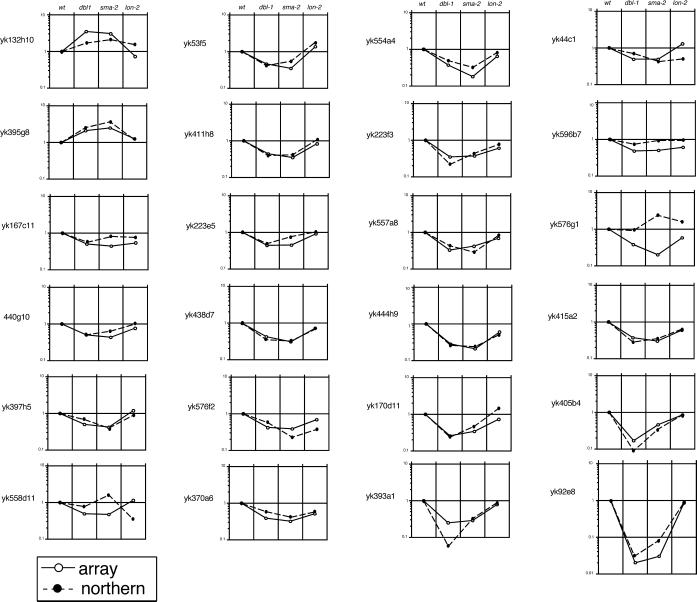
Figure 2.
Comparison of gene-expression profiles obtained from differential hybridization using a cDNA array and Northern hybridization. Quantified intensities obtained from the two different methods were plotted relative to the wild-type level. The vertical line shows relative intensity. Open and filled circles show results from the differential hybridization and Northern hybridization, respectively.

