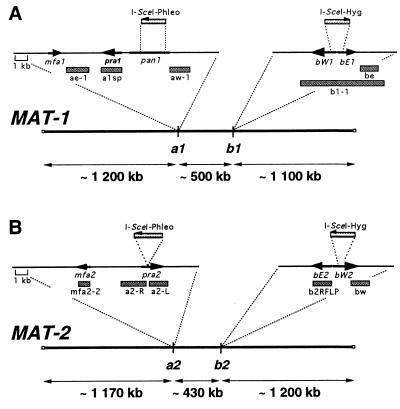
Figure 1.
Chromosomal organization of the MAT-1 (A) and MAT-2 (B) loci. The two thick lines represent the MAT chromosomes. The thin lines represent inserts of plasmid constructs used to tag the respective mating-type loci. The mfa, pra, bE, and bW ORFs are shown as black boxed arrows denoting the direction of transcription. The direction of transcription of pan1 and its location in MAT-2 are not known. The locations of probes used for the hybridizations are shown as gray bars. For details on the organization of the gene complexes, see ref. 17.

