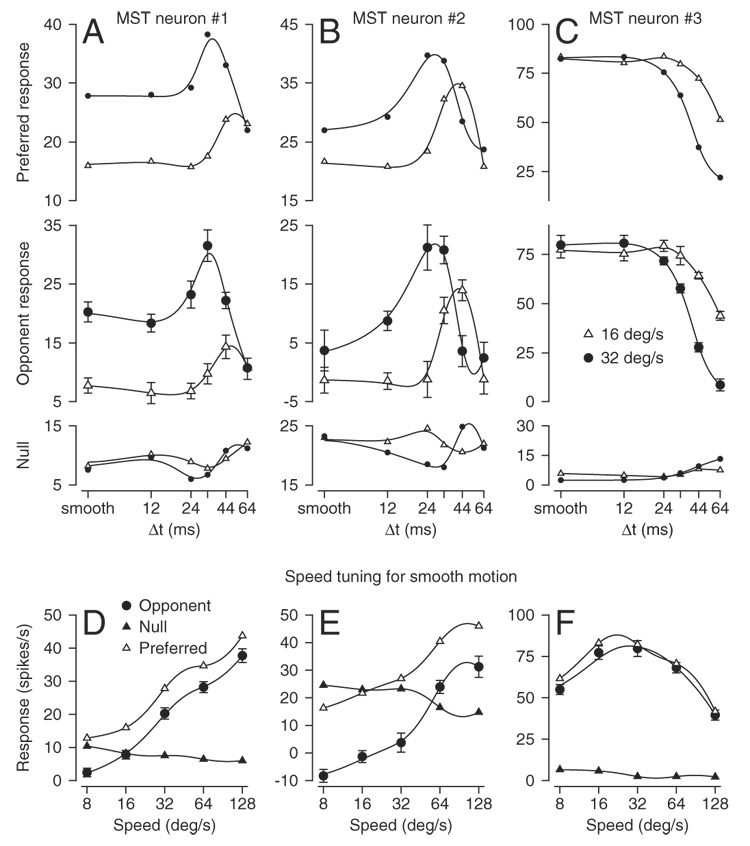
FIG. 2.

Example responses to apparent motion from 3 medial superior temporal (MST) neurons. Each column of graphs shows response from a single neuron. A–C, top, middle, and bottom rows: graphs show the effect of the value of Δt for apparent motion on firing rate for motion in the preferred direction, opponent firing rate, and firing rate for motion in the null direction, respectively. Open triangles and filled circles show results for apparent motion at 16 and 32°/s, respectively. Ticks on the x-axes labeled “smooth” refer to apparent motion when Δt was 2 ms. D–F: relationship between firing rate and stimulus speed for smooth motion (Δt = 2 ms). Filled circles, open triangles, and filled triangles show opponent, preferred, and null direction responses, respectively. In all 12 graphs, the smooth traces indicate the cubic smoothing splines used to fit the data.
