
FIG. 6.
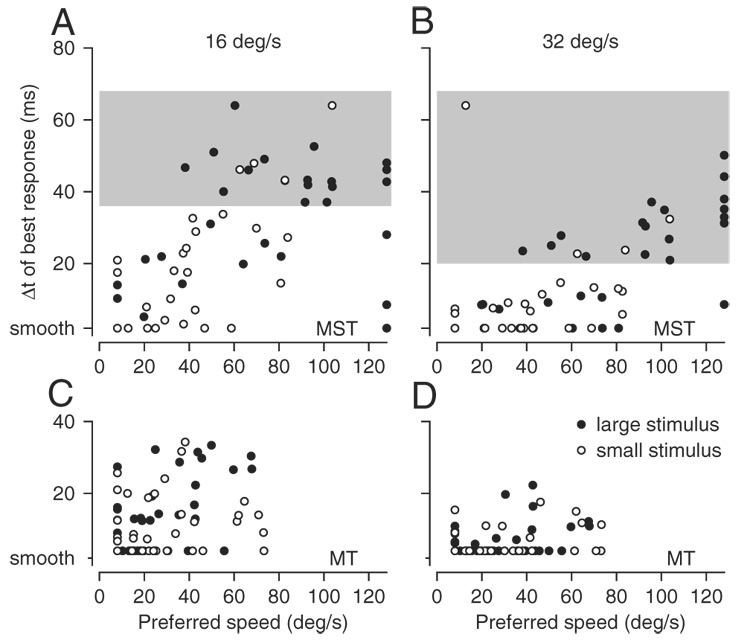
Effect of stimulus size on the responses of MST and MT neurons to apparent motion. A and C: apparent motion at 16°/s. B and D: apparent motion at 32°/s. A and B: MST. C and D: MT. Each point plots the response of an individual neuron and shows the value of Δt that evoked the largest response as a function of the preferred speed. Filled and open circles show responses for large (30 × 30°) and small (8 × 8°) textures of moving dots. Each neuron is represented by 2 symbols in each graph. Note that the 2 symbols for a given neuron need not plot at the same value of preferred speed because this parameter was derived separately for each of the 2 stimulus sizes. Ticks on the y-axes labeled “smooth“ refer to apparent motion when Δt was 2 or 4 ms for recordings in MST and MT, respectively. A and B show the data from 33 MST neurons studied with both the large and small stimulus; C and D show the data from 39 MT neurons studied with both the large and small stimulus. Areas shaded gray in A and B represent regions of the graph where MST neurons plotted but MT neurons did not. Because many points overlapped at the minima on each axis, there appear to be fewer points than the numbers given above in some of the graphs.