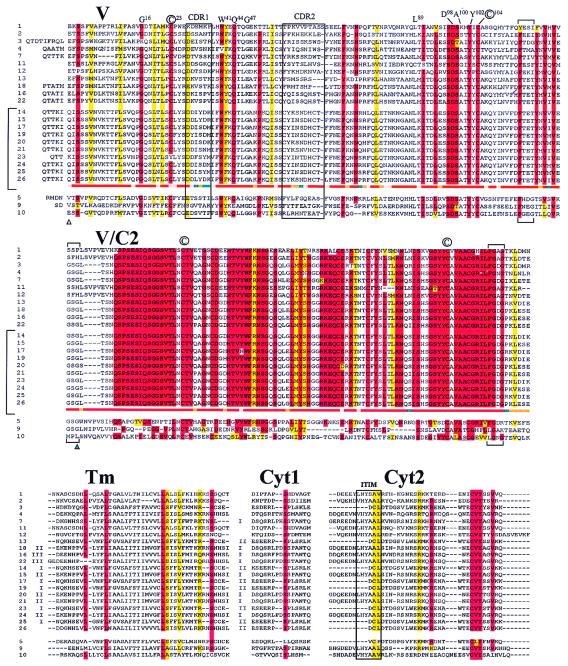
Figure 3.
The predicted peptide structures of the V, V/C2, TM, Cyt1, and Cyt2 of the 24 NITR genes encoded in PAC 19B20; pseudogenes 6 and 8 are not included. Genes are listed in an order that facilitates intergenic comparisons; vertical brackets in V and V/C2 enclose the 10 members of the SN6A type-1 gene family. ▵, Uncertainties with regard to the mature start site of NITR genes, referenced to gene 10; alternative start sites are predicted, as described (18). The basis for the designation of V and V/C2 domains in exon II is based largely on the homologous relationship of the NITR genes to Ig and TCR V domains (Fig. 1b), the shorter lengths of V/C2 domains and the relative locations of V/C2 exon/intron boundaries (▴) in two other species of bony fish, in which an intron separates the (two) extracellular Ig domains. The outlier genes (5, 9, and 10) are separated. Note the interspersed color bands and extensive regions of nonidentity in the three designated outliers, particularly in V/C2. For reference purposes, positions that are (highly) conserved between VH, Vκ, Vλ, TCRVα, and TCRVβ are designated in one-letter code by using International Immunogenetics Database (IMGT) numbering (Fig. 1b legend); conserved cysteine is circled. The location (by reference to Ig/TCR designations) of sequence regions corresponding to CDR1 and CDR2 as well as the boundaries of the glycine bulge (J homology) regions, [(F)GXG], are shown by brackets above and below the alignments. Absolute identity is shown in red (up to one difference is allowed); substitutions that result in changes which retain functional groups, defined conservatively as: G or A; I, L, M, or V; K or R; S or T; F or Y; D or E; and N or Q, are shown in yellow. Recognized TM and Cyt1 families are designated by Roman numerals to the left of the alignments. ITIMs in Cyt2 are enclosed. Variation among the members of the SN6A type-1 gene family (enclosed in a vertical bracket) are shown in the continuous horizontal color bars below gene 26. Positions at which no variation occurs are shown in red; a single amino acid difference in one family member is shown in pink; one amino acid substitution in two or more family members is shown in orange; two or more different substitutions in multiple family members are shown in blue. The comparison is referenced to the predicted start site of gene 10.

