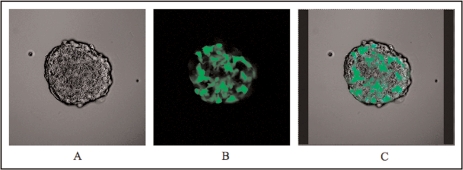
FIGURE 1.
Fluorescent confocal microscopic images of optical sections through a transfected mosaic spheroid composed of 50% NAT-expressing cells and 50% GFP-expressing cells. (A) phase contrast image of an equatorial optical section showing all cells present within the spheroid; (B) GFP-expressing cells only; (C) merged image showing GFP-labelled cells superimposed upon the phase contrast image.

