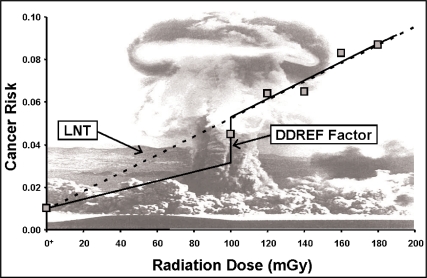
FIGURE 1.
LNT risk function which is usually based on data derived from high doses delivered at high rates from the atomic bombings in Hiroshima and Nagasaki, Japan. The high-dose LNT curve is reduced by a DDREF when evaluating the risks at low doses and dose rates. Even so, the slope of the dose-response curve can never be negative (i.e., a hormetic response curve). The notation O+ is used to represent the natural background radiation dose, presented as though it were located at zero.

