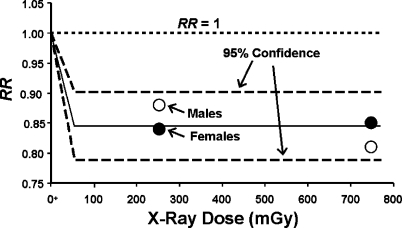
FIGURE 5.
Applications of the HRR model to lung cancer data for humans (TB patients) exposed to fractionated X-ray (diagnostic) doses, based on data reported by Howe (1995). Data for males and females were jointly analyzed. The two dashed curves indicate the 95% confidence region RR = 1 -PROFAC. The central curve is based on the average value for RR for the four data points. Such averaging is justified based on the HRR model. The notation O+ is used to indicate the natural background radiation dose, presented as though it were located at zero.

