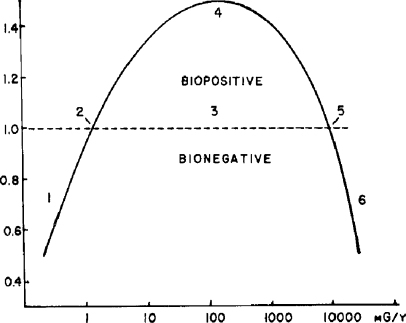
FIGURE 2.
Idealized, complete dose-response curve. The ordinate indicates approximate responses compared with the controls. The abscissa suggests mammalian whole-body exposures as mGy/y. The numbered areas are: (1) deficient, (2) ambient, (3) hormetic, (4) optimum, (5) zero equivalent point, and (6) harmful.

