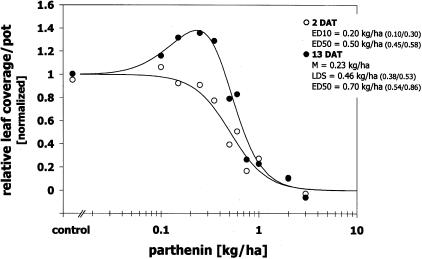
FIGURE 4.
Effect of parthenin on leaf area of Sinapis arvensis at two (2 DAT) and 13 days after spray application (13 DAT; exp. 2, August 2006). Responses are normalized to controls. M = dose giving maximum stimulation; LDS = limited dose for stimulation or ED1 (dose causing 1 % inhibition); EDK = dose causing K % inhibition; 95 % confidence interval for estimates in parentheses.

