
Figure 1.
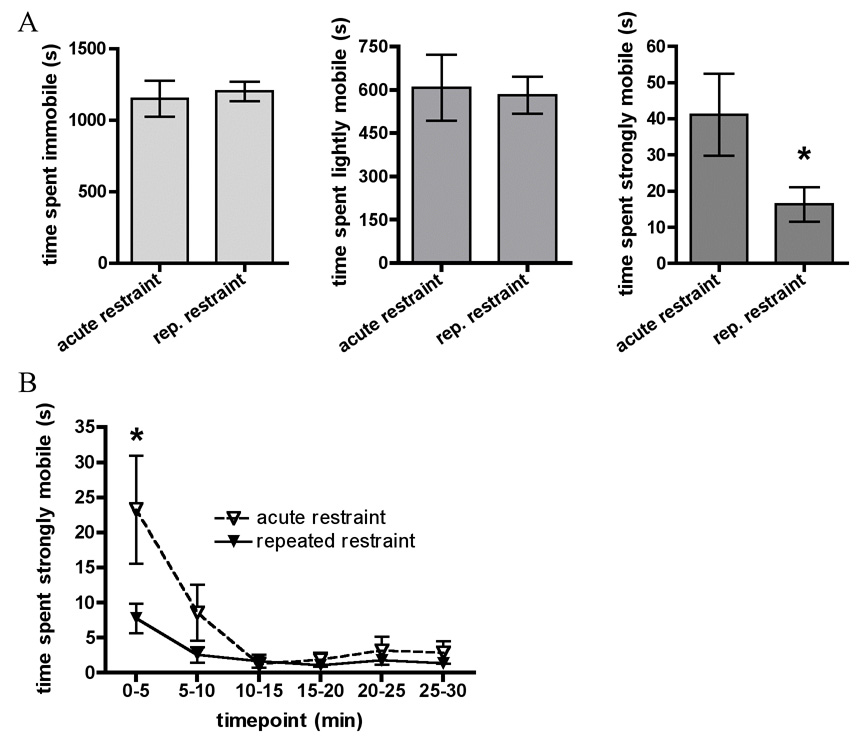
In Experiment 1, animals were restrained on day 5 with (repeated restraint group) or without (acute restraint group) 4 prior days of repeated restraint stress. A. Graphs show total time spent immobile, lightly mobile, and strongly mobile (struggling) during 30 minute restraint on day 5. B. Timecourse of time spent strongly mobile (struggling) across 30 minute restraint on day 5. All data are expressed as mean ± SEM. Asterisks indicate repeated restraint group values significantly different from acute restraint group values.