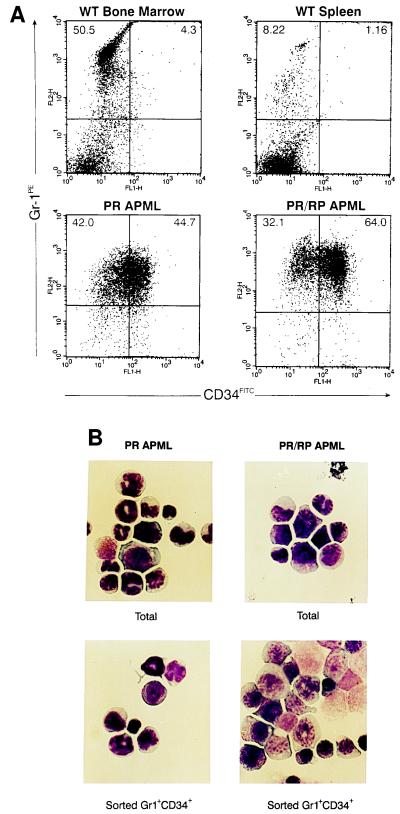
Figure 4.
Flow cytometric analysis of APML cells. (A) Flow cytometric plots of WT bone marrow and spleen cells compared with PR and PR/RP APML spleen cells. All cells were stained for myeloid surface antigen Gr-1 (Gr-1PE) and the early hematopoietic progenitor marker CD34 (CD34FITC). The indicated gates were used to determine the percentage of cells positive for Gr-1 vs. Gr-1+/CD34+. (B) APML spleen cells were analyzed by Wright–Geimsa staining before and after flow cytometric sorting. Note that Gr-1+/CD34+ populations are enriched for early myeloid cells.

