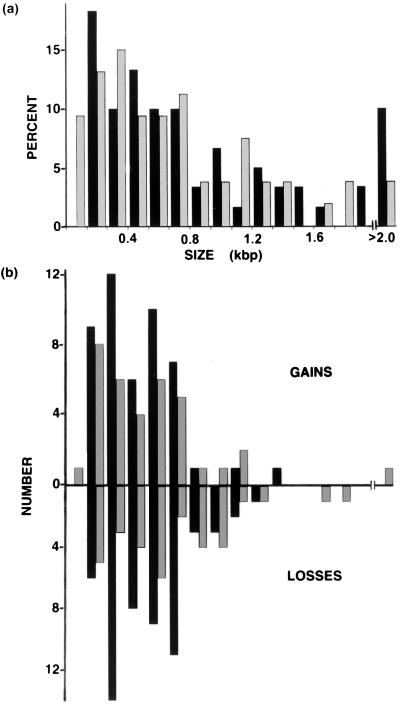
Figure 2.
The size distribution of altered bands is similar to the size distribution of total inter-SSR PCR products. (a) Size distribution of inter-SSR PCR products for 58 human colorectal cancers. The number of inter-SSR PCR products for (CA)8RY-primed (black bars) and (CA)8(RG)-primed (gray bars) reactions was determined for each 100-bp size interval. (b) The number of new or lost inter-SSR PCR bands was determined for each indicated 100-bp size interval. New bands or bands with increased intensity in the tumor are shown by bars above the x axis; bars below the axis indicate lost bands or bands with decreased intensity in the tumor.

