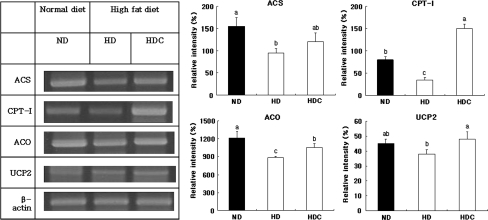
Fig. 1.
Hepatic mRNA expression in mice. Values are means ± SD. Values with different lowercase letters within the same panel are significantly different at P < 0.05 by Duncan’s multiple range test. ND Normal diet control, HD high fat diet control, HDC HD plus 40% Cheonggukjang, ACS acyl-CoA synthase, CPT-I carnitine palmitoyltransferase I, ACO acyl-CoA oxidase, UCP2 uncoupling protein 2

