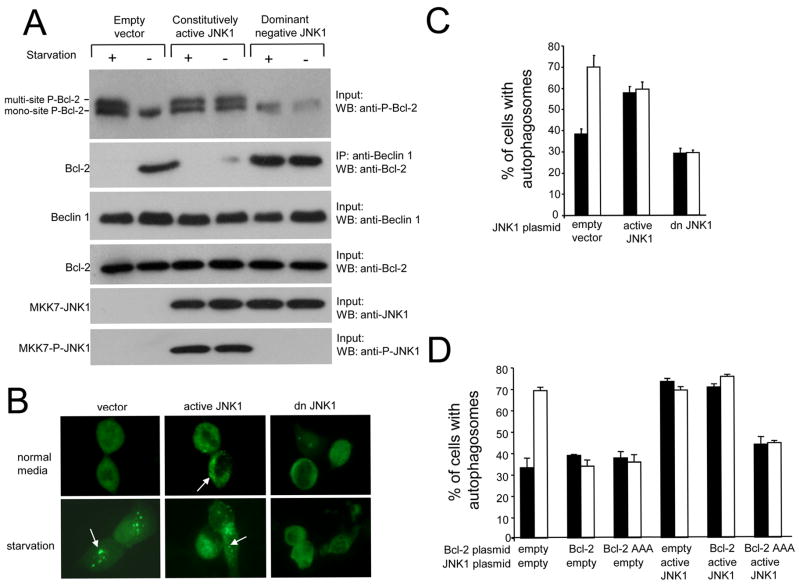
Figure 6. Constitutively Active and Dominant Negative JNK1 Regulate Bcl-2 Phosphorylation, Bcl-2 Binding to Beclin 1 and Starvation-Induced Autophagy.
(A) Effects of constitutively active JNK1 and dominant negative JNK1 on Bcl-2 phosphorylation (upper panel) and Bcl-2 co-immunoprecipitation with Beclin 1 (second panel) in MCF7.beclin 1 cells during growth in normal media (starvation -) or in HBSS for four hours (starvation +). Lower panels represent total amount of Beclin 1 (third panel), Bcl-2 (fourth panel), MKK7-JNK1 (fifth panel) or active MKK-JNK1 (MKK-P-JNK1) (sixth panel) detected in cell lysates by Western blot analysis with indicated antibody.
(B) Representative images of GFP-LC3 staining in MCF7.beclin 1 cells co-transfected with GFP-LC3 and indicated plasmid. Arrows denote representative cells containing GFP-LC3 dots (i.e. autophagosomal structures).
(C and D) Light microscopic quantitation of autophagy in MCF7.beclin 1 cells co-transfected with GFP-LC3 and plasmid(s) indicated below x axis. Results shown represent mean ± SEM for triplicate samples of greater than 100 cells per sample. Similar results were obtained in three independent experiments.

