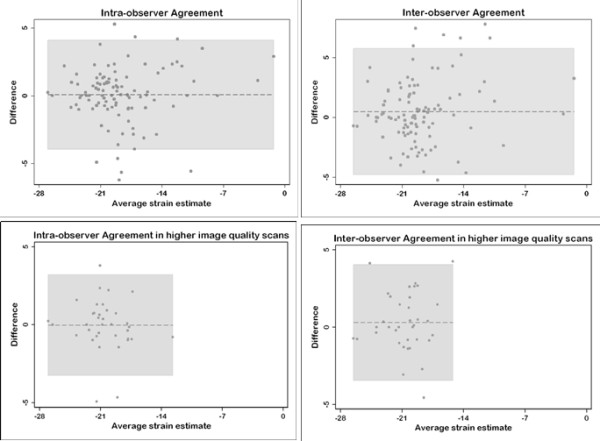
Figure 6.

Bland-Altman plots for intra-observer and inter-observer agreements. Higher image quality scans showed higher degree of agreements. In all plots, the dashed lines represent the mean difference and the gray shaded areas represent the limits of agreements.
