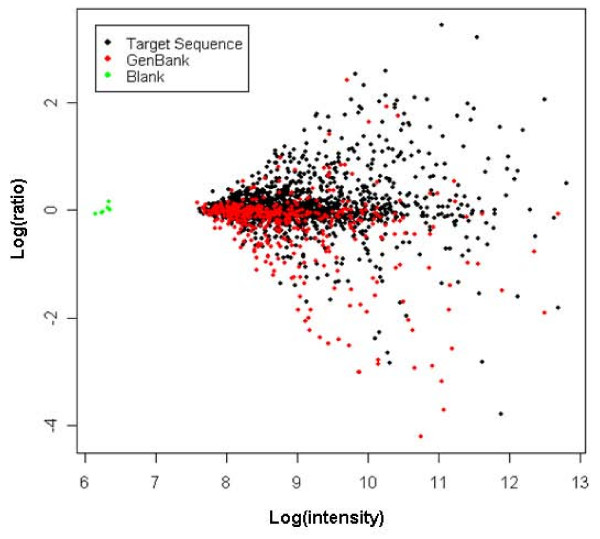
Figure 2.
Results of transcript profiling experiments using the custom designed pea SAM Combimatrix 2 K chip. Expression profiles of SAM were compared with those of NM tissues. Average plot were generated from the experimental data of four independent biological replicates after normalization (see Materials and Methods for details). Black dotsrepresents data generated from the sequences derived from this study while red applies to those from the GenBank. Green corresponds to empty spot on the array. log(ratio) = log10(ISAM/INM); log(intensity) = 0.5 log10(ISAM.INM) where ISAM and INM are signal intensities for a transcript in the SAM or the NM tissues, respectively.

