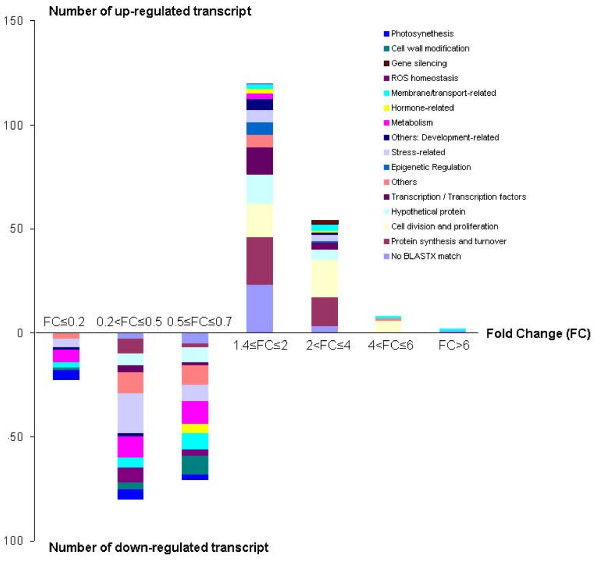
Figure 4.
Functional categories of transcripts differentially expressed in the pea SAM. The number of genes differentially expressed between the pea SAM and NM (p < 0.05) with changes in expression higher than indicated cut offs of the fold change are plotted with different functional categories highlighted by colour coding. Transcripts corresponding to cell division and proliferation, epigenetic regulation, and gene silencing are among the up-regulated categories while stress response and the metabolism class of genes are in down-regulated categories.

