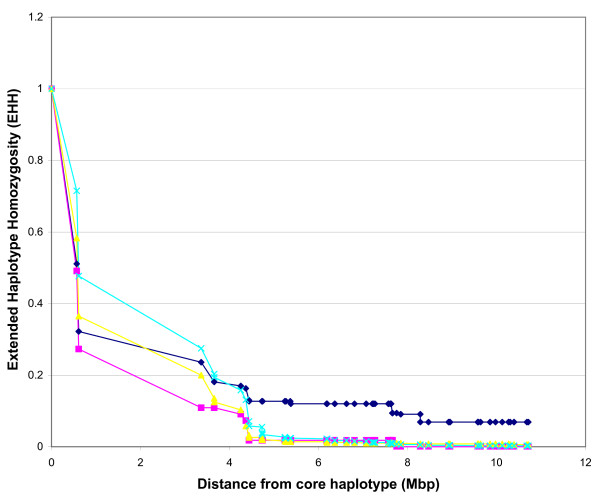
Figure 6.
Extended haplotype homozygosity (EHH) graph for Angus cattle. EHH values in Angus evaluating the decay of LD on either side of the core haplotypes. Values are plotted as a function of increasing marker distance on Angus cattle. Markers BTA-34956 and BTA-35941 were used to make up the candidate region near acyl-CoA:diacylglycerol acyltransferase 1 (DGAT1). Marker positions are represented in mega base pair (Mbp). The pink plot represents haplotype CC with 6.41% frequency. The blue plot represents haplotype CA with 13.9% frequency. The yellow plot represents haplotype AC with 18.5% frequency. The light blue plot represents haplotype AA with 61.3% frequency.

