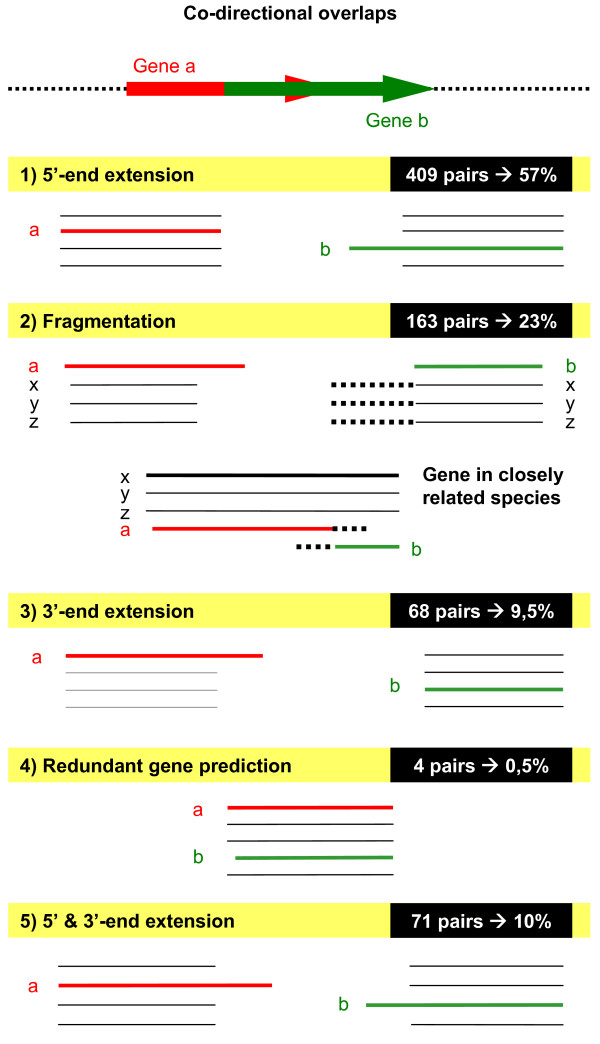
Figure 1.
Types of misannotation. Schema of the five categories of putative misannotations. Both the number and the percentage of co-directional overlapping pairs longer than 60 bps classified in each group is shown. Gene a represents the upstream gene, while gene b represents the downstream gene. In Fragmentation type gene x, y and z represent the orthologs of gene a and b.

