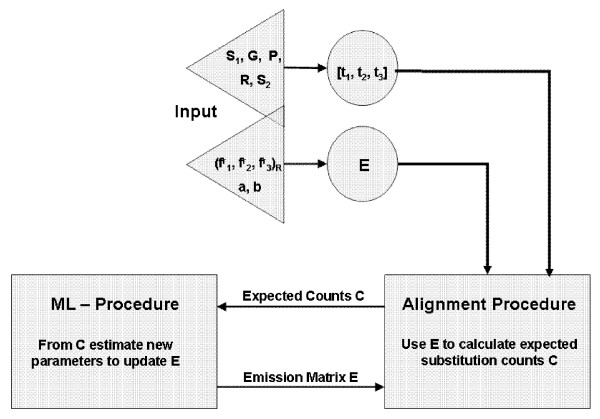
Figure 6.
Model Setup. A graphic representation of our method. As input, we give the 'ancestral' sequence S1, its gene structure G, our desired partition P and our region annotation R of the partition segments. We also input the 'descendent' sequence S2, as well as our seed parameters for , a, and b. From this we may generate both our seed emission matrix E and the type-annotation-array t = [t1, t2, t3] belonging to each locus along the sequence S1. These then get input into our alignment procedure, which subsequently over the sum of all possible alignments, calculates the expected counts C of a certain substitution of a certain type in a certain region. This information gets transferred to our maximum-likelihood (ML) method, which generates our new parameter values, maximizing the expected observations C. The resulting emission matrix E gets fed back into our alignment procedure, and the loop continues until a change in parameters is below some given threshold.

