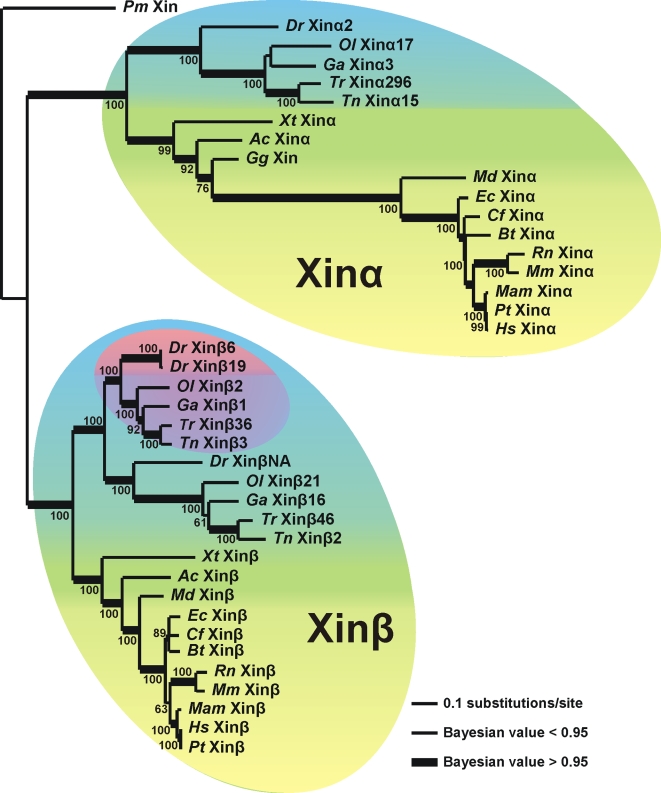
Figure 2. Evolutionary relationships of the Xin repeat region.
The CLUSTAL W multiple sequence alignment [42] shown in Figure S1 was analyzed in maximum likelihood (ML) and Bayesian analyses. Bootstrap values are shown near each node for the ML analysis. Bayesian values greater than 0.95 are represented with thicker lines. Lamprey Xin repeat region (Pm Xin) was used as the outgroup. The tree replicates the phylogeny of these taxa, with the mammal, other land vertebrates and teleost (bony fish) phylum-level groups highlighted in yellow, green and blue respectively. The original gene duplication that produced Xinα and Xinβ proteins is illustrated by their monophyletic groupings that are respectively labeled. The additional multiplication of Xinβ in teleosts is highlighted in purple and the additional Xinβ gene duplication in zebrafish is highlighted in pink. Scale bar: 0.1 substitutions per site.

