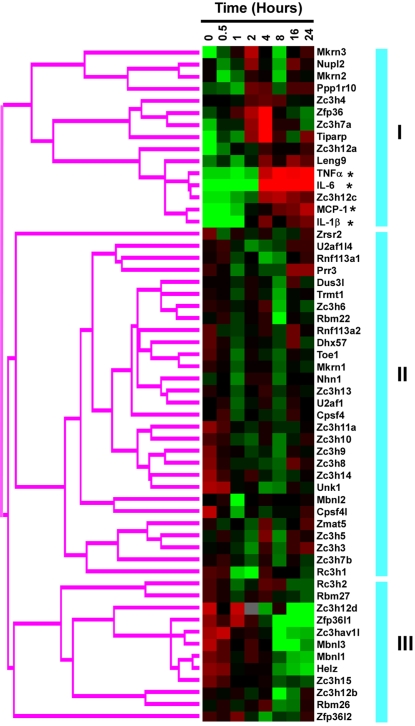
Figure 5. Hierarchical clustering of mouse CCCH family relative to dynamic expression profile during macrophage activation.
The primary macrophages were stimulated with LPS for different times as indicated on the top. The mRNA expression profile of the mouse CCCH family during macrophage activation was evaluated by hierarchical clustering using Cluster2.11 software as described in “Materials and Methods”. The CCCH family was mainly divided into three groups based on their dynamic expression patterns and indicated by the blue vertical bars on the right of the figure. Red is represented as high expression level, whereas green means low expression level. Several markers of macrophage activation were also analyzed together and marked with asterisk (*).

