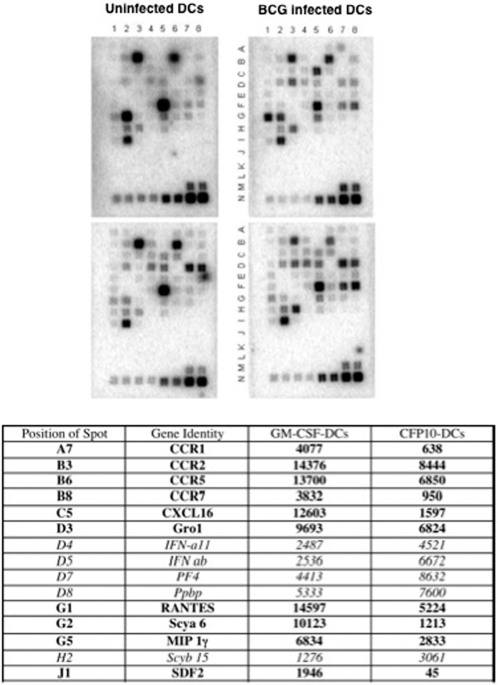
Figure 4. BCG infected CFP10-DCs show reduced expression of pro-inflammatory chemokines.
Total RNA was enriched from either GM-CSF-DCs (upper panels) or CFP10-DCs (lower panels) following infection with 1 MOI BCG (upper right and lower right panels) for 24h. 1 μg RNA was processed for microarray analyses using the GEArray Q Series mouse chemokine and receptor gene array from SuperArray strictly following the manufacturer's instructions. Rows A–I contains genes for various chemokines and their receptors while rows M and N contain house-keeping genes. Rows J–L represents negative controls. The Table below the figure depicts genes, their position and densitometric units of spots from blots of BCG infected GM-CSF-DCs and BCG infected CFP10-DCs. Data from one of two experiments are shown.

