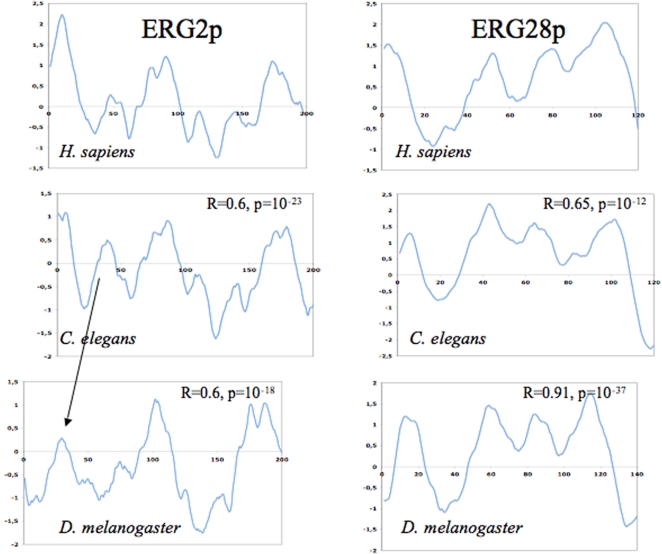
Figure 4. Hydrophobic profiles of several potential ERG orthologous proteins.
A way to show a structural relationship is to predict the hydrophobic profiles of the relevant proteins. Here we have used the TopPred program [36] as implemented in the server of Pasteur Institute (http://www.pasteur.fr). Left panels show the results for the potential homologs of ERG2p while the right panels display the profiles for ERG28p homologs (using the Kyte-Doolitle scale, with the default parameters). Negative (positive) values represent hydrophobic (hydrophilic) segments. A way to statistically assess the similarity of two profiles is to calculate their correlation coefficient R. R-values for pairwise comparisons with the human sequence are reported. We tried to maximize the R-value by slightly sliding one profile over the other (that is why the frames of the profiles are not perfectly aligned).

