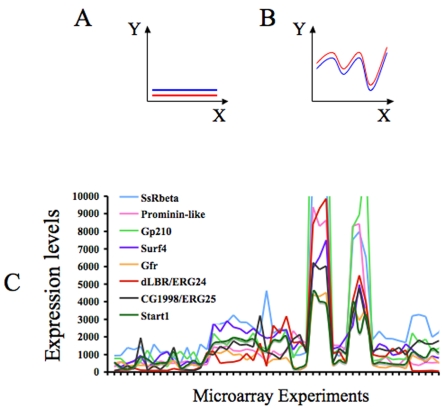
Figure 5. Expression profiles of several genes expressionally correlated with dLBR and CG1998.
Panels A and B show schematic profiles displaying very strong R. However, in panel A “co-variation” is not very informative, in this case either the red and blue genes are not expressed or do not change their expression in the conditions analyzed. To avoid this artificial inflation of R, we have focused on experiments where the genes of interest display strong variation (as in panel B). Panel C: Expression profiles of several genes involved in protein trafficking and folding, which co-vary with the expression of dLBR and CG1998. The profile of Start1 is also represented.

