
Figure 1.
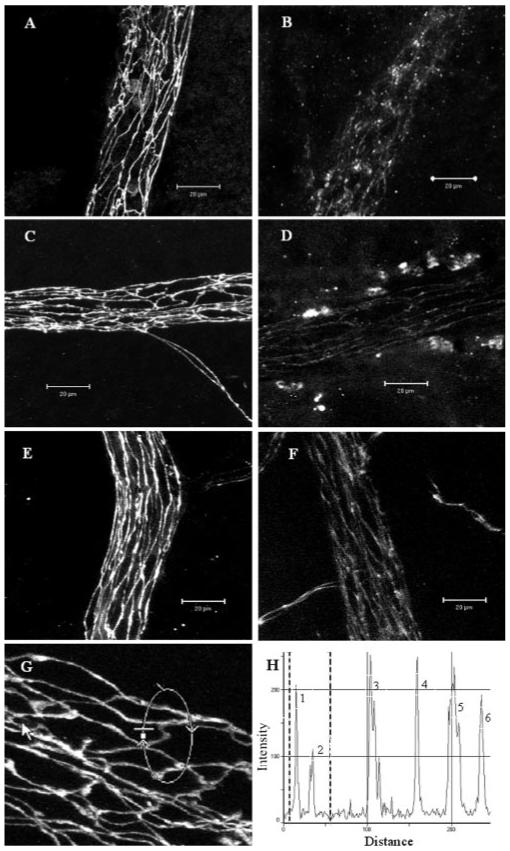
Confocal images of TJ protein expression in retinal venules of normal and EAU mice. Retinal wholemounts from normal nonimmunized B10R.III mice (A, C, E, G) or day 12 pi mice (B, D, F) were stained with anti claudin-1/3 (A, B), anti occludin-1 (C, D, G), and anti ZO-1 (E, F). All TJ proteins were evident at the interfaces between adjacent endothelial cells of retinal vessels from normal B10R.III mice and only weakly appeared in inflamed venules. (H) Histogram of fluorescence intensity of occludin-1 along the circular track shown in (G). Peaks 1 and 2 are two junction sites within the marked area in (G). Peaks 3, 4, and 6 are three tricellular corner sites. Fluorescence intensity of occludin-1 was not reduced in the tricellular areas. Images shown are reconstructions of a series of Z-stacks (15-30-μm thickness) of retinal venule segments. Bars, 20 μm.