
Figure 4.
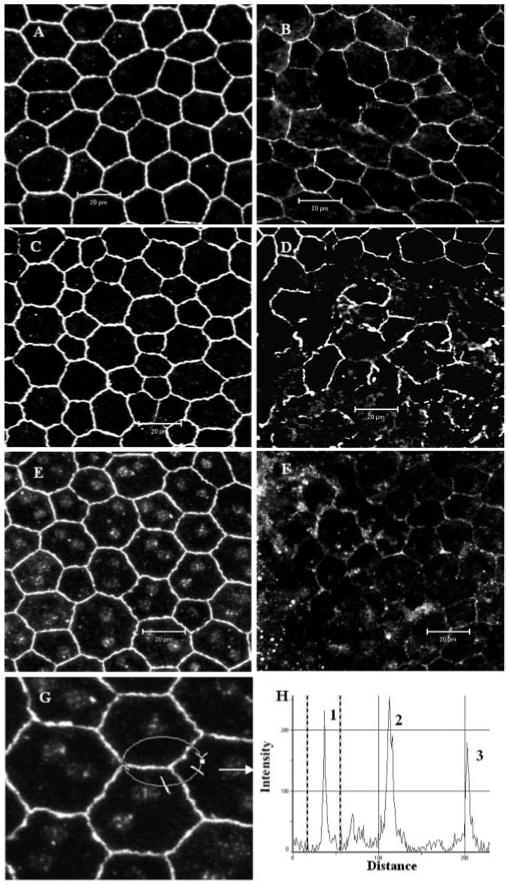
Confocal images of TJ protein expression in RPE cells of normal and EAU mice. Wholemounts of choroids (include RPE) from normal nonimmunized B10R.III mice (A, C, E, G) or day 12 pi mice (B, D, F) were stained with anti claudin-1/3 (A, B), anti occludin-1 (C, D), and anti ZO-1 (E, F, G). All TJ proteins were detected around the entire circumference of RPE cells from normal B10R.III mice and markedly disrupted in inflamed RPE cells. (H) Histogram of fluorescence intensity of ZO-1 along the circular track shown in (G). Peaks 1 and 3 are two cell border sites and peak 2 is the tricellular corner site. Images are reconstructions of a series of Z-stacks (12-μm thickness). Bars, 20 μm.