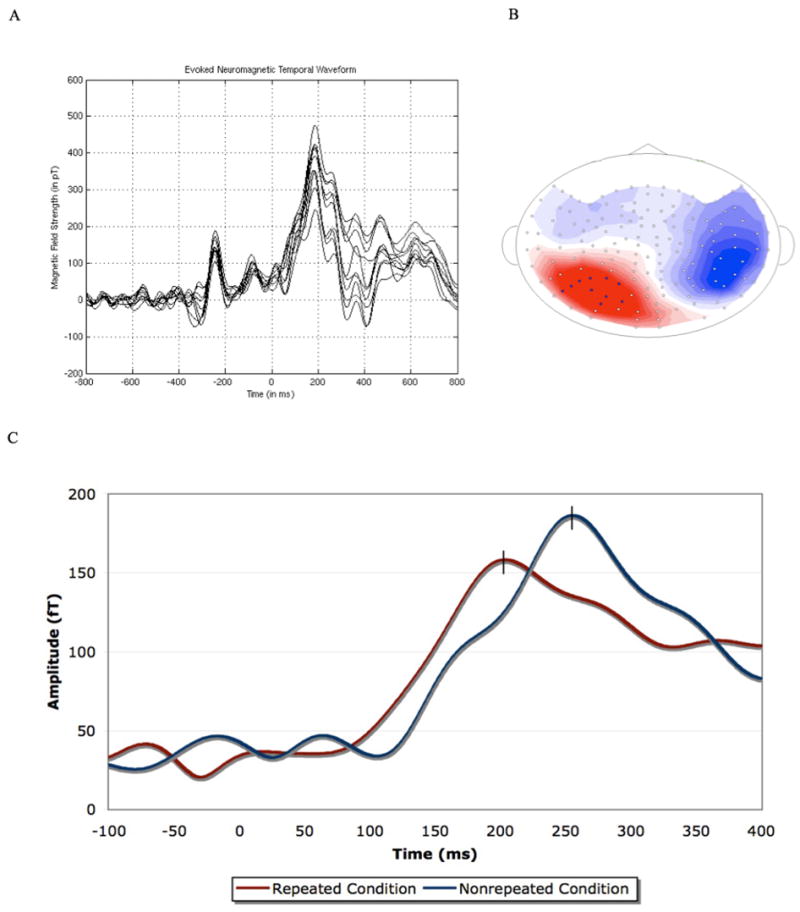
FIGURE 3.

(A) An overlay plot of ten channels (those selected) from the source of the component (left posterior). Time 0 indicates the onset of the target. Because they are all taken from an outgoing magnetic field (source), only the positive components of the waveform are present. The data is from one representative subject. (B) The magnetic field distribution of the one robust component elicited in both experiments from one participant. The magnetic field distribution presented is that of the repeated condition (the red coloration indicates an outgoing magnetic field (source), while the blue coloration indicates an incoming magnetic field (sink); note that the visible sink and visible source are not generated from the same dipole as they are in different hemispheres). (C) RMS waveform of the one robust identifiable peak identified after the onset of the target. Time 0 indicates the onset of the target. Data is from representative subject. Note that the apparent difference in amplitude was not reliable across participants, while the difference in latency was.
