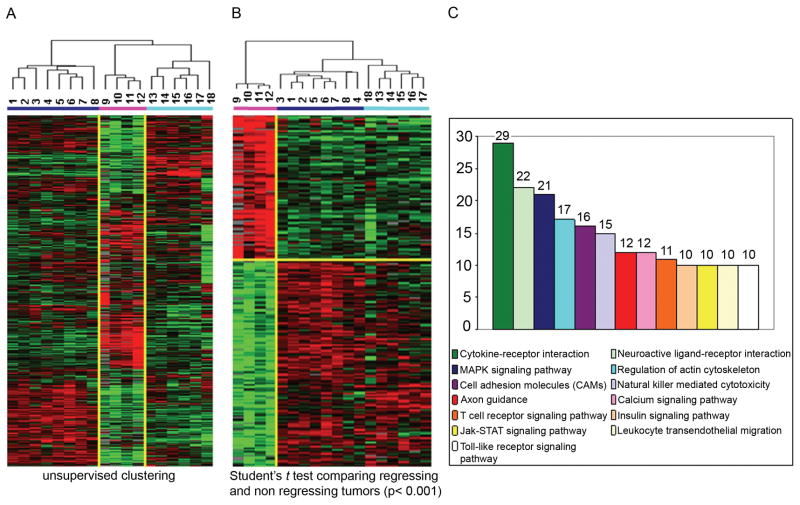
Figure 2. Gene expression profiling and gene oncology pathway analyses in tumor regressing and tumor non-regressing groups.
(A) Unsupervised cluster visualization of genes differentially expressed among regressing tumors (pink bar) and non regressing tumors (blue bar = evasion model; turquoise bar = tolerogenic model). MMC tumors were harvested 10 days after challenge and hybridized to 36k oligo mouse arrays. 11256 genes with at least 3fold ratio change and 80% presence call among all samples were projected using log2 intensity. (B) Supervised cluster analysis (Student t test, p< 0.001 and fold change >3) comparing regressing tumors (pink bar) and non regressing tumors (blue bar = evasion model; turquoise bar = tolerogenic model). 2449 differentially expressed genes have been selected for further analysis. (C) Gene Ontology databank was queried to assign genes to functional categories and up-regulated genes within the tumor regression group to functional categories.

