
Figure 4. Activity and food cup entries during the test sessions for conditioned reinforcement.
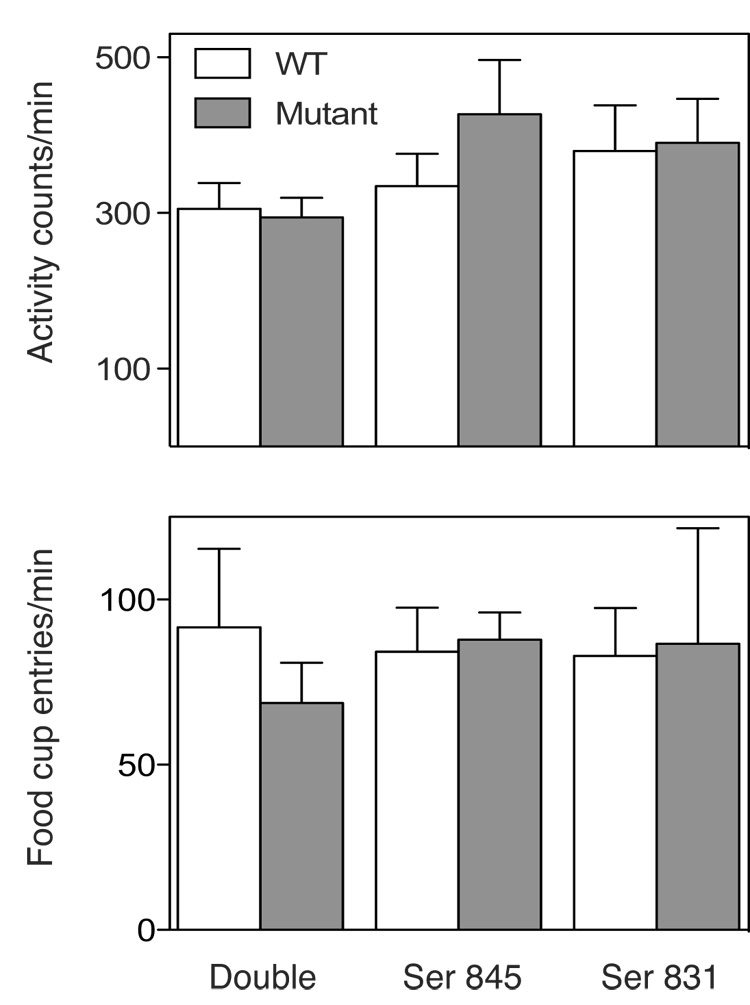
Average number of locomotor activity counts (panel a) and food cup entries (panel b) during the tests for conditioned reinforcement of double and single point phosphorylation site mutant and WT mice. The error bars show ± SEM.