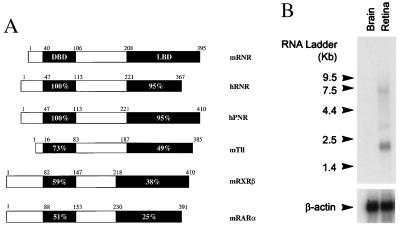
Figure 1.
(A) Comparison of mouse RNR with human RNR, hPNR, and other closely related nuclear receptors. The DBD and LBD regions of each receptor was compared with the corresponding region of mRNR by using gcg bestfit (Genetics Computer Group, Madison, WI). Numbers in the bars show the percentage of amino acid sequence identity to mRNR. The small numbers above the bar indicate the boundaries of different regions based on amino acid residue position. (B) Northern blot analysis on mRNA from human brain and retina. Each lane contains 2 μg of poly(A)+ RNA. β-actin was used to normalize hybridization signal.

